Skip to content

Event-driven market intelligence

QuantPulse

Solo project · 2026 · Java 21, Spring Boot, RabbitMQ, PostgreSQL

In short

QuantPulse is an event-driven market intelligence platform for the Casablanca Stock Exchange: four Spring Boot services over a RabbitMQ backbone, a PostgreSQL store, a Python analytics service and a Next.js dashboard.

The interesting part isn't the finance. It's that the data provider's free tier allows 100 requests per day — and that one number drives nearly every structural decision in the system.

The problem

Covering all 81 listed instruments with a 100-call daily budget rules out the obvious design immediately. One request per stock per refresh exhausts the budget before the market has been open an hour, and there is no amount of retry logic that fixes arithmetic.

The design turns on one observation from reading the provider's API properly: GET /stocks?limit=200 returns all 81 instruments in a single call. A full market snapshot costs one request, not 81. That turns an impossible problem into a budget I can schedule against — roughly 65 calls a day for whole-market snapshots every 15 minutes during the session, index data, and a prioritised end-of-day history backfill.

The second problem follows from the first: if the budget is that tight, development and tests can't spend any of it. Both run entirely off 36 recorded fixtures, so a full mvn verify makes zero live calls.

Product tour

Market overview
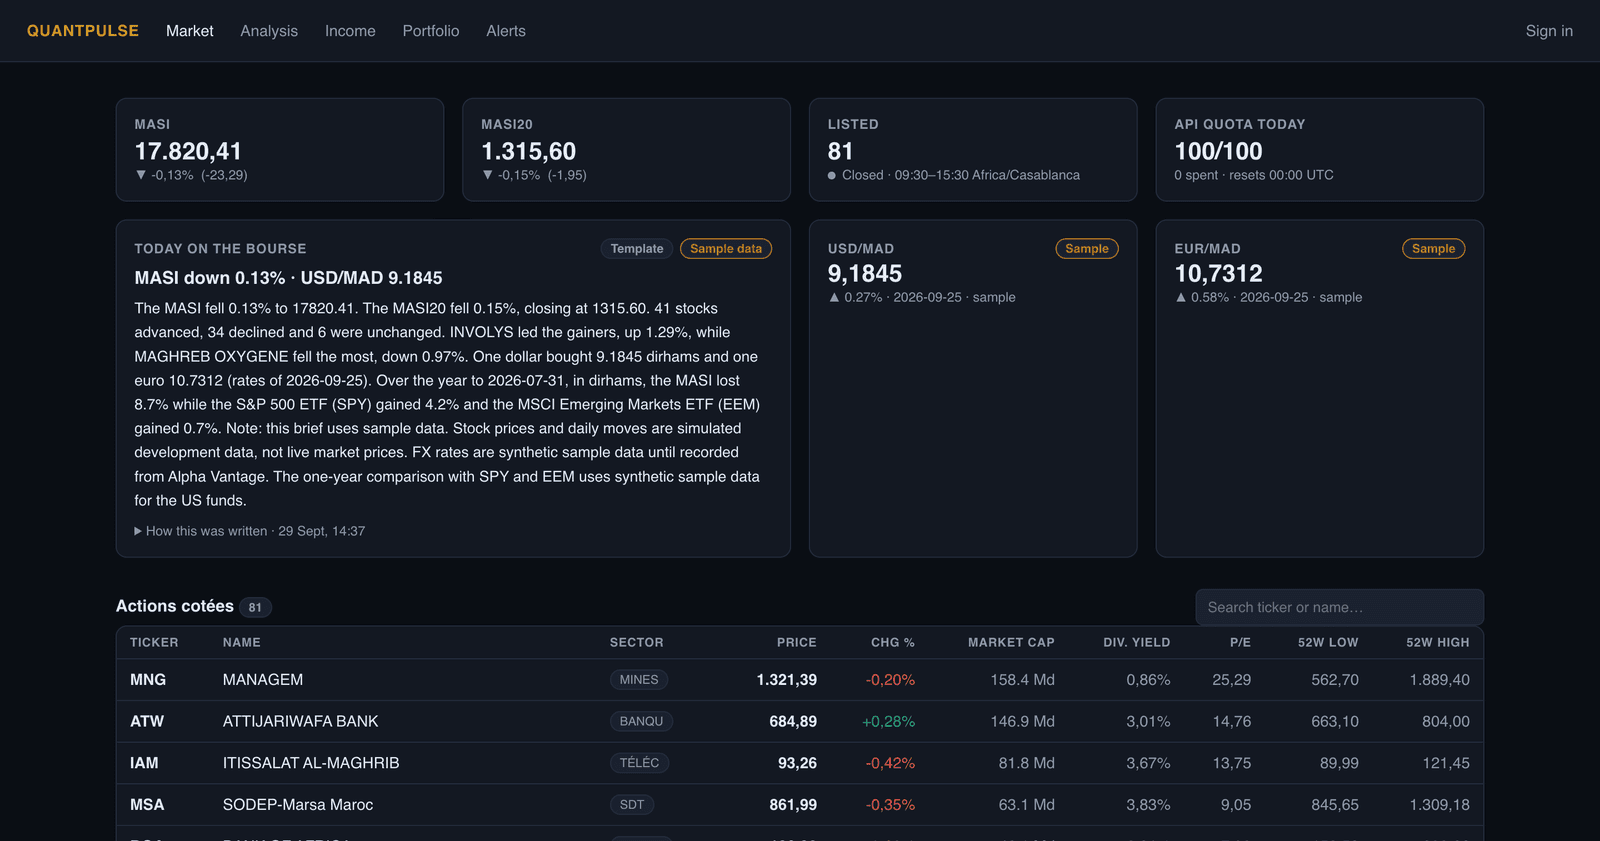
Market overview — The MASI, MASI20, the day's brief and all 81 listed instruments, with a quota banner tracking the 100-request budget in real time — every synthetic figure is labelled, never shown as a live price.
Instrument detail
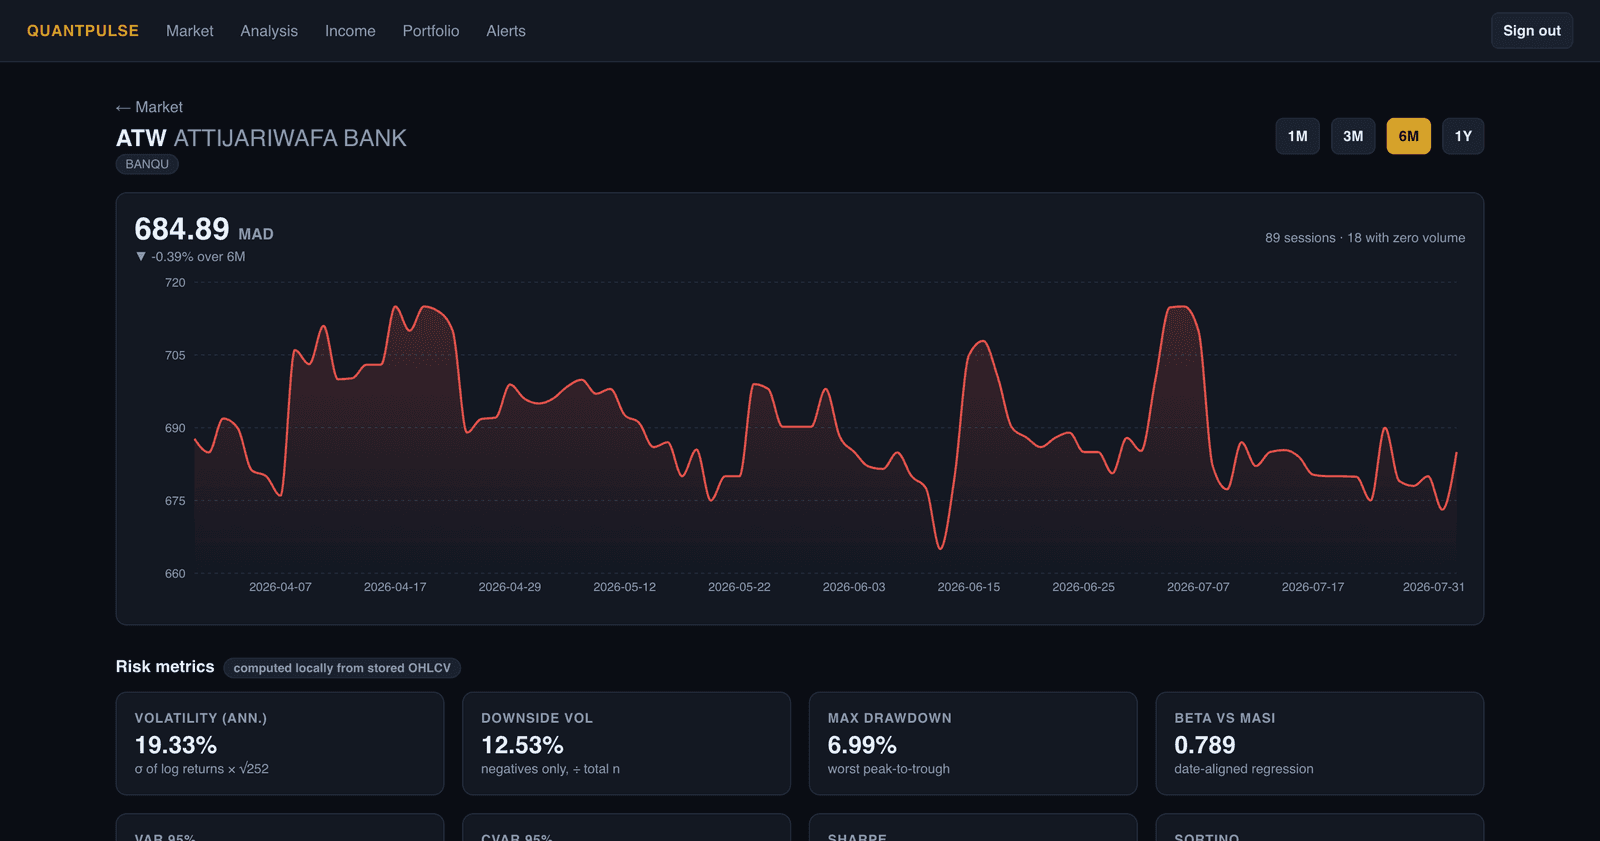
Instrument detail — Six months of ATW with the risk metrics below it — volatility, downside volatility, max drawdown, beta — computed locally from stored OHLCV, not fetched from anywhere.
Casablanca vs. the world
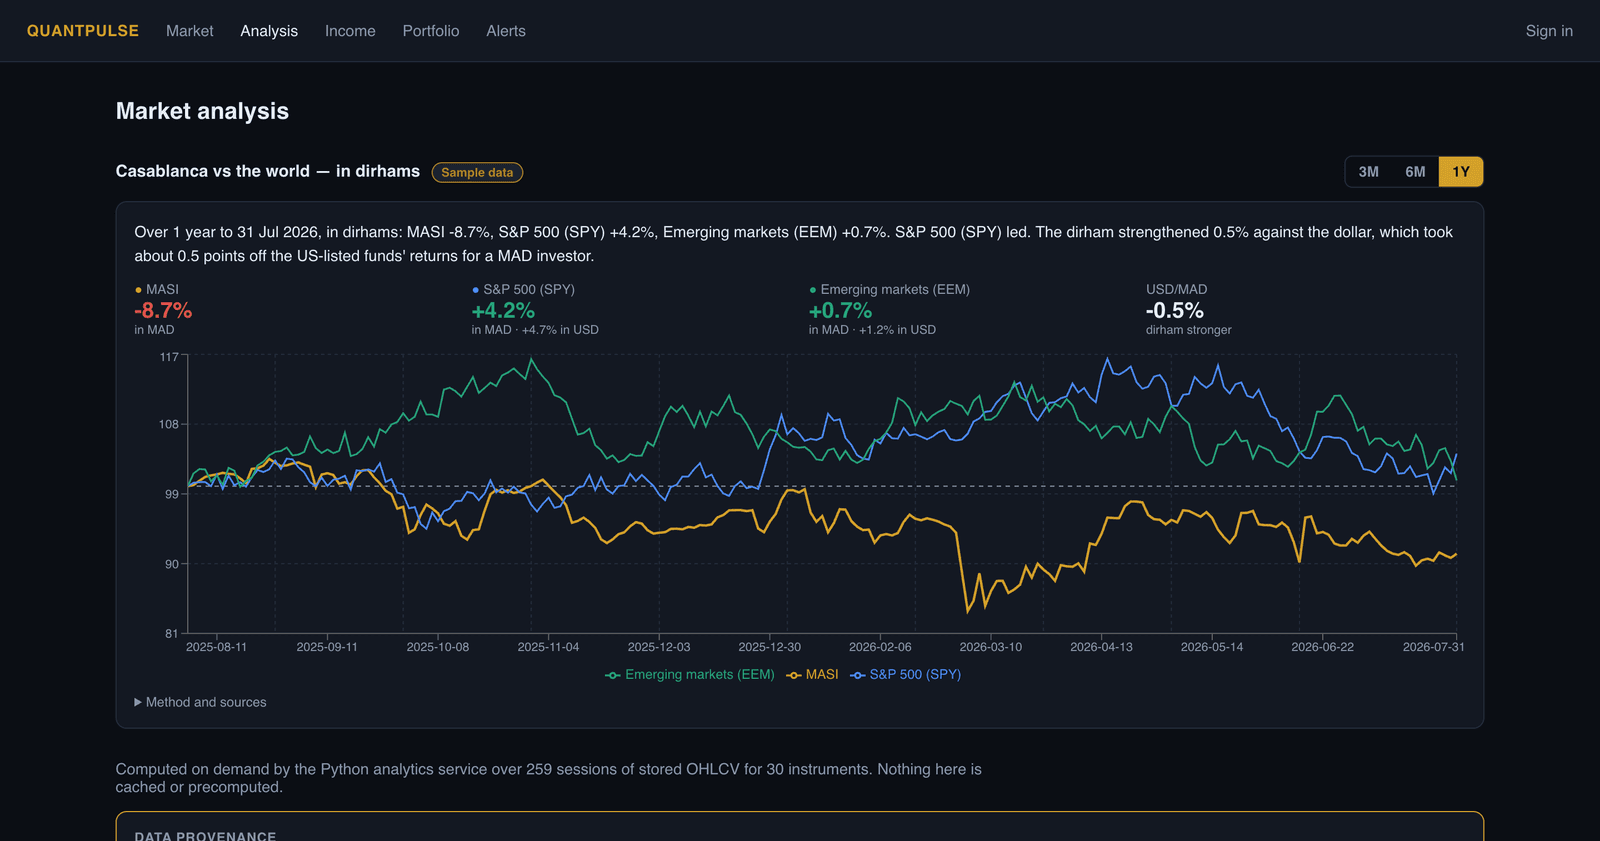
Casablanca vs. the world — MASI against the S&P 500 and MSCI Emerging Markets, rebased to the same currency and start date, computed on demand over 259 stored sessions — nothing here is cached or precomputed.
Dividend income
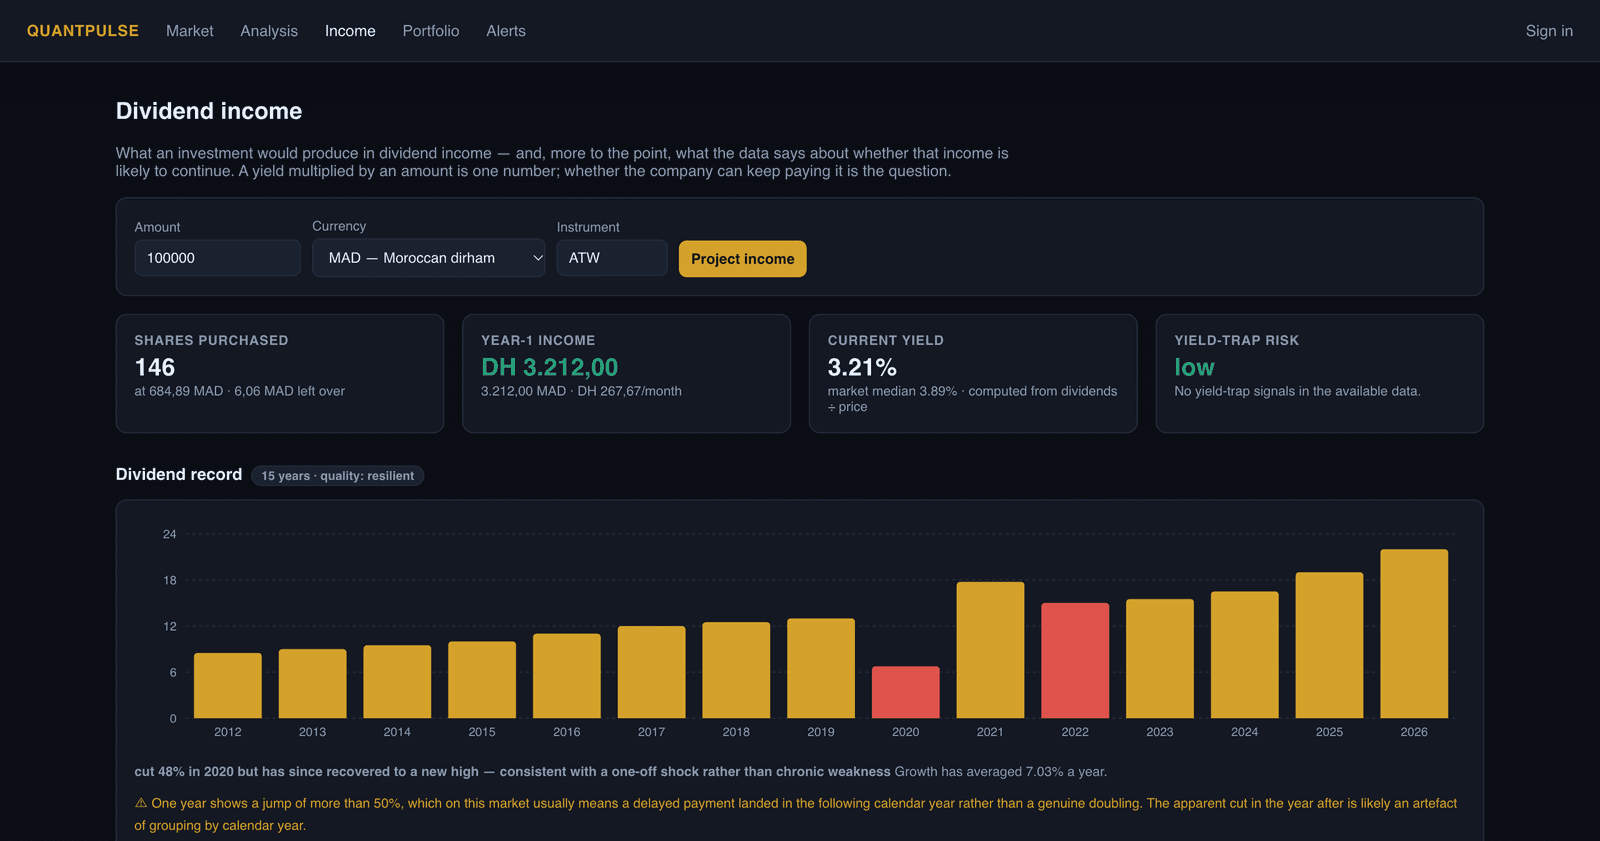
Dividend income — A yield times an amount is one number; whether the payout continues is the harder one — the 15-year record flags 2020's cut as a one-off shock rather than chronic weakness.
Portfolio tracking
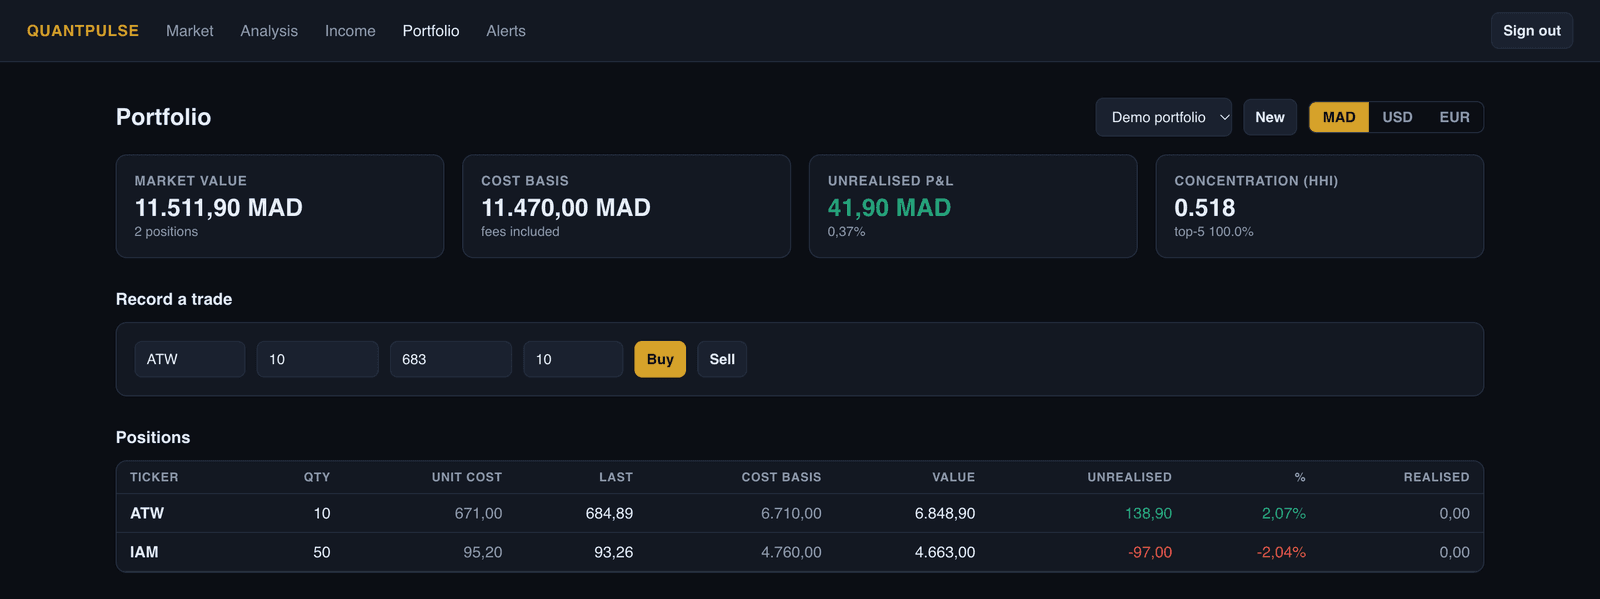
Portfolio tracking — Positions, cost basis and unrealised P&L over a real trade history, priced in whichever of MAD, USD or EUR you choose.
Price alerts
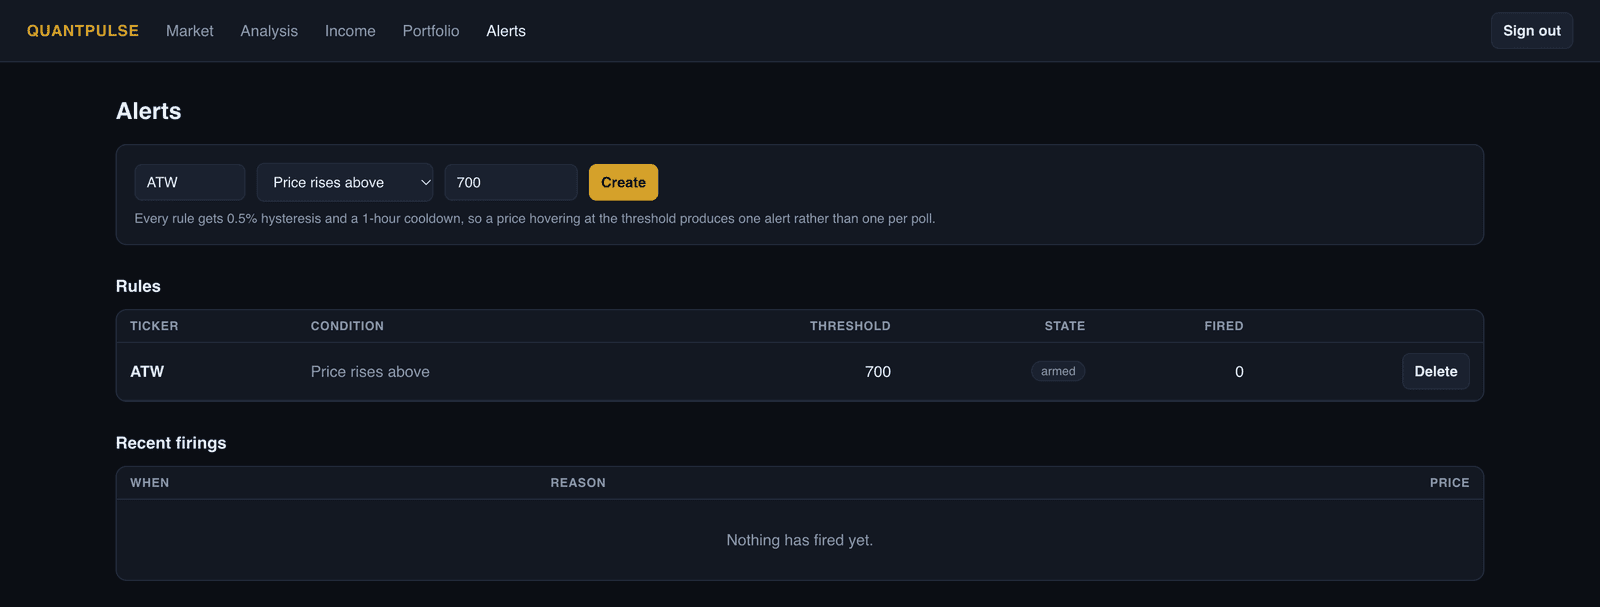
Price alerts — A rule armed on ATW rising above 700 MAD — 0.5% hysteresis and a one-hour cooldown keep a price hovering at the threshold from firing on every poll.

Architecture

Drahmi API100 requests/day · delayedquota governor · breaker · L1+L2 cacheqp-marketdatasole upstream ownerqp-quantPython · PCA, Monte Carlotransactional outboxRabbitMQtopic exchange · DLQ · parking lotqp-portfoliomoney arithmeticqp-alertsstream processingqp-apiBFF · the only reachable serviceqp-webNext.js dashboardone schema and one login role per service — no cross-schema grants

One service owns the rate-limited upstream; everything downstream learns about the market from events, never from the provider.

Four Spring Boot services and one Python service, each with a reason to be separate.

  • qp-marketdata is the only component that talks to the rate-limited upstream and the only writer of market data. One place to spend a request means one place to enforce a budget. In front of the provider: a quota governor, a Resilience4j circuit breaker, and a two-level cache (Caffeine in-process, Redis shared) with TTLs matched to the upstream's own data delay.
  • Transactional outbox. Market data is written and the event is published as one atomic decision. Without it, a crash between the two leaves the database and the rest of the system permanently disagreeing.
  • RabbitMQ — a topic exchange declared explicitly, with dead-letter queues and a parking lot for messages that fail repeatedly.
  • qp-portfolio owns money arithmetic and transactional integrity; qp-alerts is stream processing. Both learn about the market from events.
  • qp-api is a backend-for-frontend with JWT and server-sent events, and the only service the browser can reach. qp-web is the Next.js dashboard.
  • qp-quant (Python, FastAPI, NumPy/scikit-learn) does the analytics that would be miserable on the JVM.
  • One Postgres instance, one schema and one login role per service, with no cross-schema grants. OHLCV history is partitioned by month. Scheduling is market-hours aware in Africa/Casablanca, with ShedLock so a scaled instance doesn't double-spend the quota. Micrometer → Prometheus → Grafana throughout.

Decisions & trade-offs

Schema-per-service, enforced by the database

Separate services sharing one schema is the standard way to build a distributed monolith: the boundary exists in the diagram and nowhere else. Here each service has its own schema and its own login role, and no cross-schema grants exist — qp_portfolio selecting from market.* fails with permission denied. The anti-pattern isn't discouraged, it's impossible by construction. The cost is that sharing data requires a deliberate act: an event, or an API call. That's the point.

A transactional outbox rather than publish-after-commit

Publishing straight after the commit is one line of code and wrong in a way that only shows up under failure: crash between the two and the row exists while the event never happened. Writing the event into the same transaction as the data and relaying it separately makes the two consistent by construction. The price is at-least-once delivery, so every consumer has to be idempotent — which is a property I'd want anyway, and considerably easier to reason about than a silently-divergent database.

A separate Python service for the analytics

Mixing runtimes is a cost paid forever, so it needed justifying. The justification is that PCA, hierarchical clustering, Monte Carlo simulation and Markowitz optimisation are a solved problem in NumPy/SciPy/scikit-learn and a research project on the JVM. qp-quant reads OHLCV over qp-marketdata's HTTP API rather than reaching into its database, so the boundary is a contract rather than a shared table.

Forecasts return distributions, never point predictions

The analytics service returns percentile bands and outcome probabilities from a Monte Carlo under GBM — never "the price will be X". Alongside it runs a walk-forward, out-of-sample calibration backtest that reports whether the model's own intervals are honest.

That backtest earned its place immediately: it found a real defect in the first implementation, where equal-weighted volatility produced 90% intervals containing 100% of outcomes — intervals far too wide to be useful, and wrong in the flattering direction. It drove the switch to EWMA. Residual overconfidence on the most volatile instrument is reported rather than hidden.

What was hard

Delivery semantics. At-least-once means the persistence consumer will eventually see the same tick twice, and a duplicate price row is a silently wrong chart, not a crash — the worst failure mode there is. Idempotent writes on a natural key were the fix, and it changed how I write consumers generally: assume you'll be called twice.

The rate limit itself was the other one, in a way I didn't expect. Reading the provider's documentation carefully turned out to be worth more than any amount of caching cleverness — and the documentation and the actual API disagree in 11 documented places, each of which I had to find and write down. Building against a fixture set recorded from the real thing was the only way to develop at all without burning the day's budget by lunchtime.

Outcome

A running platform covering the whole exchange inside a budget that rules out the naive design, with 69 automated tests and a full mvn verify that spends zero API calls. The analytics were checked against reality rather than assumed: risk metrics match the provider's own published figures within about 2%, and the clustering never sees sector labels — so where it agrees with the official sector classification, that agreement is evidence rather than an assumption baked in.

It's the first system I've built where I chose the failure modes on purpose instead of discovering them.

What I'd do next

Not deploying this publicly. Six services, a broker and three datastores are real infrastructure to keep paying for and patching, for a project whose job is to be read, not to serve traffic. The screenshots above are the actual running system; the RUNBOOK is the same commands, in order, that bring the whole thing up from a clean clone in a few minutes — on the recorded fixtures, zero calls to the real upstream. What's still worth doing on the system itself: tracing across the broker boundary, since a fully asynchronous pipeline with no distributed tracing is a bad combination; and a replay path for the parking lot, so a poisoned message is recoverable rather than merely contained.